
Racking selection often begins with the wrong question. Operators ask “what racking should I install?” when the more useful question is “how quickly does my inventory move?” — because how frequently a pallet is picked and replaced determines which racking format actually delivers value, and which one quietly becomes a bottleneck. High-turnover inventory in dense drive-in racking creates constant retrieval friction. Low-turnover inventory in prime selective racking wastes valuable floor space. Both situations are common, and both trace back to selecting racking without reference to actual turnover data.
This guide explains how to translate inventory turnover data into racking selection decisions, so operators planning a new warehouse or reviewing an existing one can identify which formats match their inventory’s actual movement patterns.
What Is Inventory Turnover, and Why It Drives Racking Selection
Inventory turnover — sometimes called stock turn, inventory turns, or inventory turnover ratio — measures how many times inventory is sold and replaced within a given period, usually a year. The basic calculation is straightforward:
Inventory Turnover = Cost of Goods Sold (COGS) ÷ Average Inventory Value

An operation with $10 million in annual COGS and $2 million in average inventory has a turnover of 5, meaning inventory cycles through the warehouse five times per year on average. Higher turnover indicates faster-moving inventory; lower turnover indicates slower-moving stock.
Why this matters for racking: Every racking format represents a specific tradeoff between storage density and retrieval speed. High-turnover inventory needs to be retrieved constantly, so density gains that compromise access speed become net losses in operational efficiency. Low-turnover inventory sits in place for extended periods, so retrieval speed matters less, and density gains directly reduce the floor space cost of holding that inventory.
Selecting racking without reference to turnover data means guessing at where inventory falls on this tradeoff — and often getting it wrong. Facilities that match racking format to turnover velocity consistently outperform those that don’t, both in throughput and in cost per pallet position stored.
Current Challenges in Turnover-Based Racking Decisions
Warehouses treat all inventory as if it has the same turnover. A single racking format applied to all SKUs assumes uniform movement patterns, when actual inventory almost always splits into distinct velocity groups.
Turnover data isn’t broken down by SKU or category. Operations may know the facility’s overall turnover ratio without knowing how it varies between fast-moving core SKUs and slow-moving reserve stock — which is exactly the breakdown needed for racking selection.
Selection defaults to what a peer facility uses. Racking decisions often follow industry norms rather than the specific operation’s actual data, which produces mismatched configurations when turnover characteristics differ from the peer average.
Historical inventory patterns get treated as permanent. SKU velocity shifts over time as product mix, seasonality, and market conditions change. Racking installed for one turnover profile may not match the operation five years later, but layouts are rarely reviewed against updated turnover data.
Cost analysis focuses on racking price, not throughput. Cheaper racking that slows retrieval on high-turnover SKUs often costs more in labor and delayed orders than the price difference saves, but this tradeoff is difficult to see without turnover-based analysis.
How Turnover Maps to Racking Format Selection
The core principle: as turnover velocity increases, the value of retrieval speed rises and the value of density decreases. As turnover velocity decreases, the opposite applies. Different racking formats sit at different points on this tradeoff curve.
Very high turnover (10+ turns per year). Extremely fast-moving inventory — daily-cycled consumer goods, e-commerce fulfillment core SKUs, essential FMCG — needs formats that prioritize retrieval speed above all else. Selective pallet racking with wide aisles and standard reach truck access provides the fastest per-pallet retrieval and works well for these SKUs. Pick modules and carton flow systems suit high-turnover small-item picking. Density-focused formats such as drive-in racking are generally poor fits for very high turnover, since the retrieval friction outweighs the density gain.
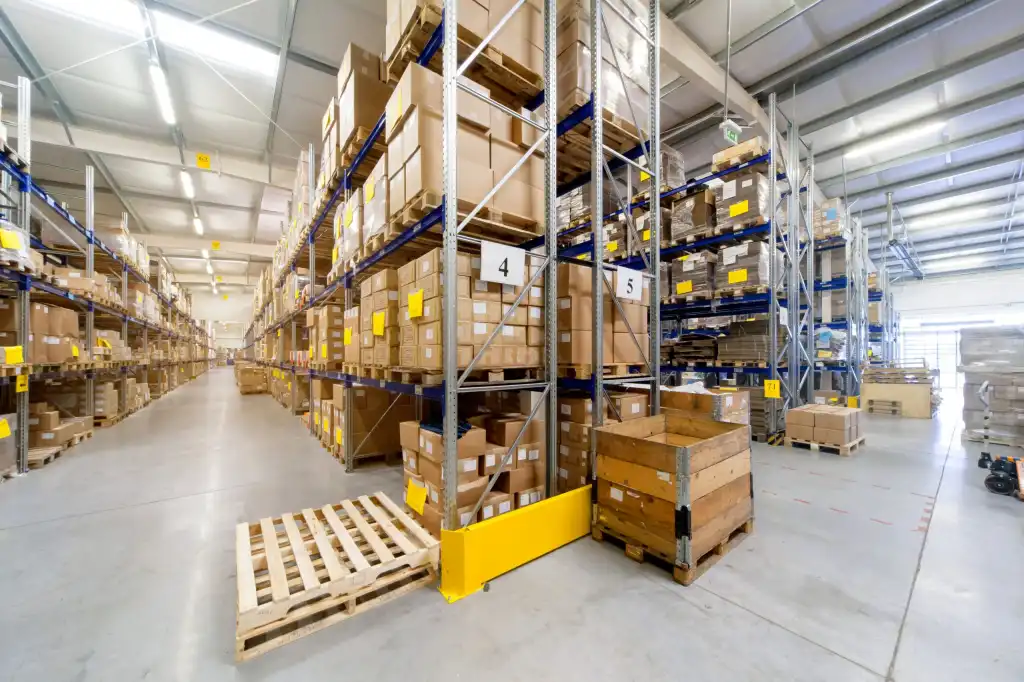
High turnover (6 to 10 turns per year). Fast-moving inventory still benefits primarily from selectivity and access speed. Selective pallet racking remains a strong default. VNA (very narrow aisle) configurations can work here, providing higher density while retaining per-pallet access, though the reduced forklift movement speed of VNA versus standard aisles should be evaluated against actual pick rates.
Moderate turnover (3 to 6 turns per year). Mid-velocity inventory sits in the transition zone where format choice depends more on specific SKU characteristics. Selective racking works well when SKU variety is high; double deep racking can add density without significantly compromising throughput when consecutive same-SKU picks are common. This is often the largest inventory category in a general warehouse, and often benefits from being segmented further by specific SKU velocity within the moderate band.
Low turnover (1 to 3 turns per year). Slower-moving inventory can tolerate density-focused formats since individual pallets are retrieved infrequently. Drive-in and drive-through pallet racking works well here for bulk homogeneous SKUs, achieving significantly higher density than selective racking. Push-back racking suits moderate-selectivity applications with 2 to 5 pallets per SKU. Radio shuttle racking can provide even higher density with better rotation control.
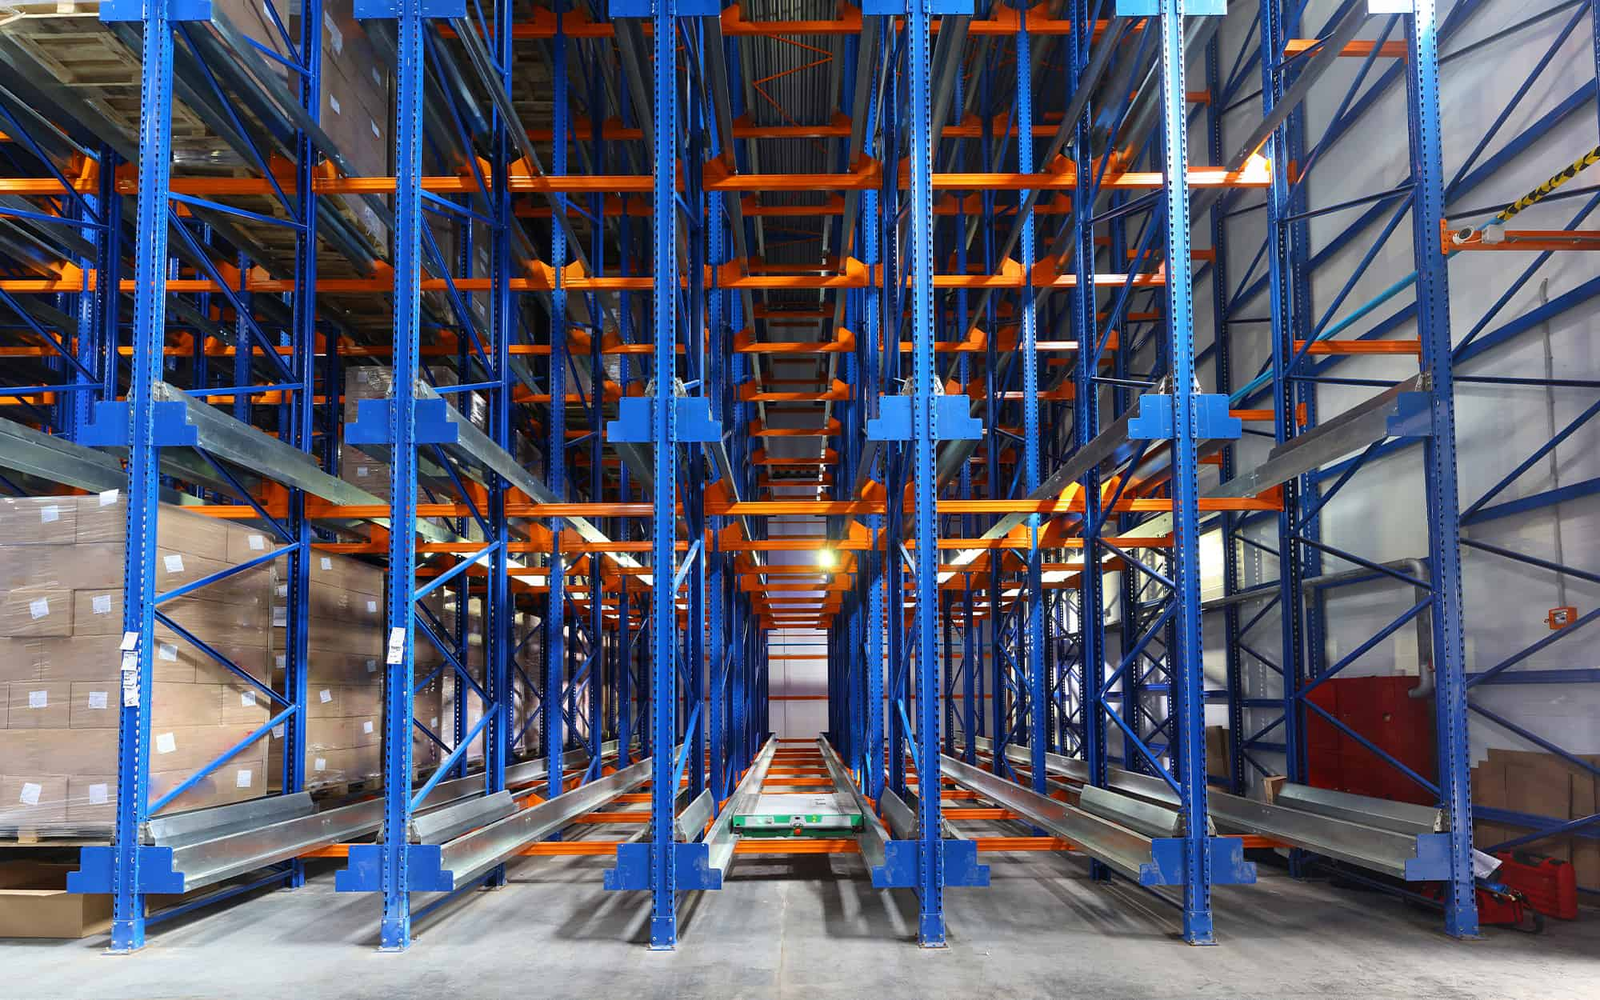
Very low turnover (under 1 turn per year). Reserve stock, seasonal inventory, and archived materials that sit for extended periods can occupy the highest-density formats without operational penalty. Drive-in racking with deep lanes, or mobile pallet racking where floor space cost is high, both deliver maximum density for inventory that rarely moves.
Highly variable turnover (mixed velocity in same operation). Most real warehouses have a mix of turnover velocities across different SKUs. The right approach is generally not to compromise on a single format, but to zone the facility by turnover velocity and apply different formats to each zone — fast movers get selective, slow movers get high-density, medium movers get formats matched to their specific characteristics.
Turnover to Racking Format Matching Table
| Turnover Rate | Inventory Character | Recommended Format | Priority |
|---|---|---|---|
| 10+ turns/year | Daily fast-movers | Selective racking, pick modules | Speed above density |
| 6–10 turns/year | Fast-movers | Selective, VNA | Speed with moderate density |
| 3–6 turns/year | Moderate movers | Selective, double deep | Balanced |
| 1–3 turns/year | Slow movers | Drive-in, push-back, shuttle | Density above speed |
| Under 1 turn/year | Reserve, archive | Drive-in deep lanes, mobile | Maximum density |
| Mixed velocities | Multi-tier SKU mix | Zone by turnover (ABC layout) | Match zone to velocity |
How to Calculate SKU-Level Turnover for Racking Decisions
Warehouse-level turnover isn’t enough for racking selection — the same operation might have some SKUs turning over 20 times per year and others turning over once every two years. Segmenting turnover by SKU or SKU category is the essential step before racking format decisions.
Step 1: Pull SKU-level movement data. For each SKU (or product category, for operations with too many SKUs to analyze individually), calculate movement over the past 12 months. Units sold or shipped are usually the simplest measure.

Step 2: Calculate average inventory per SKU. Average stock level held over the same 12-month period, typically measured in units or pallet positions.
Step 3: Compute SKU-level turnover. Divide annual movement by average inventory to get turnover per SKU or category.
Step 4: Sort SKUs by turnover velocity. Rank all SKUs from highest to lowest turnover.
Step 5: Apply Pareto or ABC segmentation. The top 20 percent of SKUs by turnover typically account for 70 to 80 percent of movement (the Pareto principle). Segmenting SKUs into velocity groups — often called A (fast), B (moderate), C (slow) categories — creates the input for zone-based racking selection.
Step 6: Map racking format to each velocity group. A-velocity SKUs get formats optimized for retrieval speed. C-velocity SKUs get formats optimized for density. B-velocity SKUs get balanced formats.
This approach converts turnover data from a general operational metric into a concrete tool for racking decisions. Operations that skip this segmentation often end up with racking that’s over-specified for slow SKUs (wasting money) and under-specified for fast SKUs (creating bottlenecks).
Zone-Based Racking Layouts Driven by Turnover Data
Most well-optimized warehouses zone their storage by turnover velocity rather than applying a single format facility-wide. The typical layout pattern:
A-zone (fast-movers, near dispatch). Located adjacent to shipping docks or pack-out areas to minimize forklift travel for the highest-frequency picks. Selective pallet racking with wide aisles, or pick modules for small-item picking, dominates this zone. Efficient A-zone layout can significantly improve overall warehouse throughput even if other zones are unchanged.
B-zone (moderate movers, mid-warehouse). Balanced formats such as selective or double deep, sized appropriately for the SKU mix and pick frequency. Located in the middle of the warehouse where travel distance is moderate.
C-zone (slow movers, back of warehouse). High-density formats — drive-in, shuttle, or mobile racking — located further from dispatch since retrieval frequency is low and travel time impact is minimal. This zone typically holds the largest number of SKUs in variety but a small portion of movement volume.
Reserve zone (very slow or seasonal). Deep-lane storage for stock that moves rarely. Often uses drive-in racking with maximum lane depth or mobile racking where floor space is expensive.
For operations combining these zones, the structural racking considerations for heavy-load zones may vary from the roll-formed configurations sufficient for lighter, high-turnover picking zones — velocity-based zoning also enables material specification to match zone requirements more precisely.
Expected Operational Improvements from Turnover-Driven Racking Selection
Warehouses that select and zone racking based on actual turnover data typically see:
- Higher pick rates on fast-moving inventory, since A-zone racking is optimized for retrieval speed rather than density
- Reduced storage cost per slow-moving pallet, since C-zone racking uses high-density formats that maximize position count per square meter
- Better use of prime floor space near dispatch, since valuable dispatch-adjacent area is dedicated to inventory that actually moves frequently through it
- Improved overall inventory turnover metrics, since operations aren’t bottlenecked by racking that slows retrieval of the fastest-moving SKUs
- More predictable throughput scaling, since velocity zones can be adjusted independently as SKU mix or volume changes
- Reduced obsolescence risk, since slower-moving inventory is easier to review and act on when it’s segregated in a specific zone rather than mixed with active stock
- Better labor productivity, since travel distances for the highest-frequency picks are minimized by zone placement
These improvements depend on maintaining accurate SKU-level turnover data over time. Static zone assignments based on outdated velocity data lose value quickly as inventory patterns change.
Project Considerations Before Redesigning Racking Around Turnover
Data quality. SKU-level turnover analysis requires reasonably accurate movement and inventory data over at least 12 months. Operations with poor inventory tracking may need to improve data collection before turnover-based racking decisions can be reliable.
Turnover volatility. Some inventories have stable turnover patterns; others are highly volatile due to seasonality, promotions, or product lifecycles. Volatile turnover profiles may require more flexible racking that can be reconfigured, rather than fixed formats optimized for stable patterns.
Seasonal peaks. A SKU that turns over 4 times annually on average may spike to 15 turns per year during peak season. Racking should support peak-period access, not just annual-average retrieval frequency.
New product introductions. Products that don’t yet have turnover history need to be assigned initial zones based on projected velocity, with reassignment as actual data accumulates.
Reconfiguration budget. Turnover-driven racking layouts benefit from periodic review — annually or after significant SKU mix changes. Some ability to reconfigure zones without full racking replacement supports this ongoing optimization.
Integration with warehouse management system. WMS platforms can automate turnover-based slotting decisions, dynamically reassigning SKUs to zones as their velocity changes. This is more scalable than manual quarterly reviews for operations with high SKU counts.
Handling equipment compatibility across zones. Different racking formats often require different forklifts — reach trucks for selective racking, VNA equipment for narrow aisle, and so on. Zone-based layouts should verify that handling equipment can efficiently move between zones as picks require.
Fire protection zoning. Density-focused formats such as drive-in and mobile racking often trigger more stringent fire code requirements. Zoning by velocity may create sub-zones with different fire protection needs that should be reviewed with a qualified engineer.
Frequently Asked Questions
What is a good inventory turnover ratio for a warehouse? “Good” varies dramatically by industry. FMCG operations often target 15 to 25 turns per year, retail commonly runs 6 to 12, industrial distribution often 4 to 8, and reserve or slow-moving stock may turn 1 to 3 times annually. Rather than a universal benchmark, the useful reference point is how turnover varies between SKUs within the same operation, which is what drives racking selection.
How do I get SKU-level turnover data if my WMS doesn’t report it directly? Most WMS platforms can export SKU movement and inventory reports that can be combined in a spreadsheet to calculate turnover per SKU. Even a rough calculation using shipment history and average stock levels is sufficient for initial racking zoning decisions.
Should I install different racking formats for different velocity zones from day one, or start with one format and adjust? For new warehouses, zone-based layouts from initial installation are generally more cost-effective than retrofitting later. For existing warehouses, targeted upgrades — installing high-density formats in specific slow-moving zones, for example — can capture much of the benefit without full facility redesign.
How often should I review turnover data and reassign SKU zones? Annual reviews are a typical baseline for most operations. Fast-changing inventories may benefit from quarterly reviews, and WMS-driven slotting systems can update zone assignments continuously as velocity data changes.
Can drive-in racking work for high-turnover SKUs if I really need the density? Generally no. Drive-in racking’s density advantage comes from limiting selectivity, which conflicts directly with the frequent, varied retrieval that high-turnover SKUs require. For high-turnover density, VNA or pick modules typically produce better results than drive-in.
How does inventory turnover interact with rotation methods like FIFO or FEFO? Turnover measures how fast inventory cycles; rotation methods (FIFO, LIFO, FEFO) determine which specific unit is retrieved when a pick occurs. Both matter, and they’re often related — high-turnover perishable inventory typically requires both fast retrieval and strict FEFO rotation, for example.
Does location within the warehouse matter as much as racking format? Yes. Placing fast-moving SKUs near dispatch reduces travel time even before considering racking format, and this locational benefit often outweighs the racking format choice for the highest-velocity SKUs.
What if my warehouse has too many SKUs to analyze individually? Category-level analysis works nearly as well as SKU-level for high-SKU operations. Grouping SKUs by product category, brand, or supplier and calculating category turnover produces velocity groupings that can drive zone decisions without needing to review every individual SKU.
Key Takeaways
- Inventory turnover velocity should drive racking format selection, since different formats deliver value at different points on the density-vs-retrieval-speed tradeoff curve
- High-turnover SKUs need selectivity and access speed; low-turnover SKUs can tolerate density-focused formats without operational penalty
- Warehouse-wide turnover data isn’t sufficient — SKU or category-level segmentation is essential for meaningful racking decisions
- Zone-based layouts matching velocity groups to different racking formats consistently outperform single-format facility-wide configurations
- Turnover data and zone assignments should be reviewed periodically, since SKU velocity shifts over time as product mix and demand patterns evolve
Conclusion
Racking selection driven by actual inventory turnover data consistently produces better outcomes than selection based on general density preferences or peer facility patterns, because it aligns storage format with the specific movement characteristics of the inventory being stored. Warehouses that segment SKUs by velocity, zone their storage accordingly, and match racking format to each zone’s turnover profile see measurably better throughput, lower cost per pallet position, and greater flexibility as inventory patterns evolve. Companies such as Lracking are commonly involved in projects where operators are working through this velocity-based zoning exercise — often combining selective racking for fast-moving zones, higher-density formats for slower-moving reserves, and reconfigurable options where inventory patterns are expected to shift. For warehouses planning racking decisions or reviewing existing layouts, starting with SKU-level turnover data — even a rough analysis — remains the most reliable way to identify which formats will actually deliver value against the operation’s real inventory profile.